Municipal Optimisation - What the Data Reveals Once You Actually Look
Municipal optimisation is not a cost-cutting exercise - and this issue of The Municipal Brief sets out what it actually means, where the structural inefficiencies consistently sit, and what it takes to move an organisation through the political and institutional realities of getting it done.
Key Takeaways
- The primary problem in most underperforming municipalities is not a funding shortfall - it is a structural misalignment between mandate, capacity and cost that more revenue alone will not fix.
- Ignite's analysis identifies four recurring fault lines: the employee cost model, the revenue-to-cash cycle, water and sanitation losses, and governance and accountability failures - and most leadership teams look in the wrong place first.
- The most useful diagnostic question is not whether staff are busy, but whether the work is necessary, being done in the right place, at the right level and in the most effective way.
- Optimisation programmes succeed when the evidence is credible and transparent enough that management, labour and council can all engage with it - and when the process begins before the final structure has already been decided.
- Drakenstein Municipality moved from serious financial difficulty and below-average performance to one of the best-performing municipalities in South Africa - the diagnostic is where that kind of turn begins.
Ignite
Ignite has been doing this work for more than two decades - long before municipal optimisation became a national policy conversation. The firm’s approach is built on a straightforward premise: that structural and financial change in a municipality is only possible once leadership is willing to accept what the evidence actually shows, including findings that are politically or personally uncomfortable.
Drakenstein Municipality faced serious financial difficulties, with poor ratings and below-average performance across service delivery. Rather than wait for intervention, its leadership accepted what the data showed, analysed the situation honestly to determine what to focus on and when, revisited its departmental structures - not simply to reduce posts, but to move capacity towards areas that needed it most - redesigned processes, refined reporting lines and consolidated duplicated work. It monitored the results rigorously. The outcome was not just financial recovery. Drakenstein became one of the best-performing municipalities in South Africa.
“Approving a new organogram is not an outcome. The outcome is a municipality that costs less where it should, has capacity where it matters, and performs better for residents. What made the difference was leadership behaviour - accepting what the evidence showed, maintaining a common message, making officials responsible and accountable, and continuing to measure the results. That last point matters.” - Attie Butler, CEO, Ignite
Ignite is a South African advisory firm specialising in municipal governance, organisational design, performance management and human capital - with senior experience drawn from inside provincial and local government, the Auditor-General’s office and top-tier consulting practice. Their work spans Eastern Cape, KwaZulu-Natal, Gauteng, Northern Cape and Western Cape. If your municipality is ready to undertake the diagnostic honestly - to connect the data, benchmark against peers and build a restructuring process that can survive the political reality - this is work Ignite has undertaken before.
The Optimisation Imperative: beyond cost-cutting to the structural performance question every municipal leadership team needs to answer.
FIRST - WHAT MUNICIPAL OPTIMISATION ACTUALLY MEANS
Municipal optimisation is often misunderstood as a cost-cutting exercise. Cost matters, of course - but optimisation is really about ensuring that every rand, every position and every process contributes to the municipality’s mandate and to services experienced by the community.
The starting point is data: the organisational structure, payroll, vacancies, overtime, acting appointments, job grades, spans of control, service volumes, financial performance, revenue collection, asset performance and the use of contractors. But collecting data is not the same as understanding it. The important step is to connect those datasets.
“The test is not merely, ‘Did we spend less?’ It is: ‘Can this municipality deliver better and remain financially sustainable?’”
Attie Butler, CEO, Ignite - The Municipal Professional Podcast
The numbers give the optimisation question its urgency. As at July 2026, municipalities owe Eskom R120.26 billion in overdue debt - a figure the Minister of Electricity and Energy has warned could reach R358 billion by 2031 if decisive intervention is not implemented. In the second quarter of 2025/26, the actual municipal collection rate against billed revenue was 69%, compared with a budgeted rate of 78.6%. In the 2024-25 audit cycle, 99 municipalities - 39% of the total - received modified audit opinions from the Auditor-General. Together, these indicators point to significant challenges in financial sustainability, institutional performance and the effective use of municipal resources.
Recent reporting by the Auditor-General and National Treasury points to recurring weaknesses in governance, institutional capability, financial management and accountability alongside the sector's fiscal pressures. Optimisation is the response to that broader diagnosis. Not as a cost-reduction exercise, but as a systematic effort to align what a municipality does, how it is structured and what it spends with what it is mandated to deliver.
“Optimisation connects mandate, demand, capacity and cost. The output is therefore not simply a recommendation to remove positions. It may mean reallocating capacity, redesigning processes, filling a critical technical vacancy, consolidating duplicated functions, changing reporting lines, improving revenue controls or reducing an unnecessary dependency on consultants.”
Attie Butler, CEO, Ignite - The Municipal Professional Podcast
WHERE THE INEFFICIENCY SITS
The four fault lines. The biggest structural inefficiencies in South African municipalities - and why most leadership teams look in the wrong place first.
Ignite’s analysis, drawn from two decades of municipal performance work across South Africa, identifies four fault lines - and why most leadership teams look in the wrong place first.
1. THE REVENUE-TO-CASH CYCLE
Incomplete or inaccurate billing information, faulty meters, unresolved account queries, weak credit control and services being delivered without the related revenue being collected. National collection rates ran at only 69% against billed revenue in the second quarter of 2025/26, against a budgeted rate of 78.6%. The gap between what municipalities are owed and what they collect is not a revenue problem - it is an operational failure at each step of the billing-to-collection chain, and it compounds every other financial pressure a municipality faces. (Source: Engineering News / National Treasury, Q2 2025/26 Local Government Revenue and Expenditure Report, March 2026)
2. THE EMPLOYEE COST MODEL
Structures that are unaffordable, too many management layers, weak spans of control, prolonged acting appointments, uncontrolled overtime and critical technical vacancies existing alongside excess capacity in lower-priority areas. This year, municipal workers received a 4.75% salary increase - against a backdrop of operating deficits across the sector. In Johannesburg, R21 billion of the city’s R84 billion annual budget goes to employee costs before a single pipe is fixed or a pothole filled. The question optimisation asks is not whether staff deserve competitive pay - it is whether the structure they sit within is designed to deliver on the municipality’s mandate. (Source: IOL, March 2026 / OurCity News, March 2026)
3. INFRASTRUCTURE MAINTENANCE
When preventative maintenance is postponed to protect the short-term budget, the municipality eventually pays more through breakdowns, emergency procurement, water and electricity losses and repeated repairs. South Africa loses an estimated R26 billion worth of treated water every year - with non-revenue water nationally at 47.3%. In KwaZulu-Natal, more than 92% of water service authorities fail to meet the 30% loss threshold considered acceptable. Every litre lost is a rand spent treating and pumping water that never reaches a household or a billing system - and a maintenance decision deferred that eventually becomes an emergency. (Source: The Citizen / DWS No Drop Progress Report, 2026)
4. PROCUREMENT AND CONTRACT MANAGEMENT
The problem is not always the tender itself. It is often weak specifications, variations, poor monitoring, scope creep, late payment, duplicated contracts or paying for outputs that were never properly verified. The Auditor-General’s consistent finding is that irregular expenditure in local government is rarely the product of outright fraud alone - it accumulates through weak contract management, inadequate supervision and a culture where exceptions become routine. Optimisation in procurement means fixing the process before it produces the expenditure, not reconciling the damage afterwards.
Leadership teams frequently assume the primary problem is that they simply need more money or more employees. Sometimes that is true. But the data often shows that the municipality first needs to use its existing resources differently. The test is not, “Did we spend less?” It is: “Can this municipality deliver better and remain financially sustainable?”
THE DIAGNOSTIC ADVANTAGE
What benchmarking and operational data reveal that a manual organisational review typically cannot see.
The gap between what a municipality intended to happen and what is actually happening - and why it matters.
Consider what a manual organisational review typically does. It begins with the approved organogram - it asks whether the boxes exist, whether job descriptions are available and whether reporting lines appear reasonable. The problem is that an organogram tells you what the municipality intended to happen. It does not tell you what is happening. The difference between those two things is exactly what benchmarking and operational data are designed to surface.
The data can reveal a department with many supervisors but few operational employees, persistent overtime alongside significant unused capacity, duplicated support functions, acting arrangements that have continued for years, and vacancies being blamed for poor performance where the real constraint is an inefficient process. None of these appear on an organogram - but all of them appear in the data, once it is properly connected and benchmarked. They accumulate gradually through appointments, reorganisations and budget pressures that each seemed reasonable in isolation, until the misalignment feels normal to everyone inside it. That is precisely why it requires data to surface, and honest leadership to act on.
THE RIGHT DIAGNOSTIC QUESTION
“The most useful question is not: ‘Is this employee busy?’ People can be extremely busy inside a poorly designed system. The question is: ‘Is this work necessary, is it being done in the right place, at the right level and in the most effective way?’ That is what the data catches - not only visible inactivity, but structural misalignment that has gradually become normal.”
Attie Butler, CEO, Ignite - The Municipal Professional Podcast
Butler is direct about what makes an optimisation programme succeed: the evidence must be credible and transparent enough that management, organised labour and council can all understand what was measured, what comparisons were used and why a recommendation follows from the data. Benchmarking must inform the discussion - it should not be presented as an unquestionable verdict. And the process must begin before the final structure has already been decided. When those conditions are met, an optimisation programme is better placed to navigate the political and institutional realities of a municipality.
FROM THE CONTINENT
KENYA · COUNTY GOVERNMENTS AND THE PAYROLL AUDIT LESSON
When Kenya devolved government to 47 counties in 2013, it inherited what the data would later confirm: bloated payrolls, duplicated functions and wage bills consuming more than half of county revenue in several jurisdictions.
The response was not primarily legislative. It was diagnostic. Kenya’s Controller of Budget and the Commission on Revenue Allocation began requiring counties to demonstrate what their payroll costs were actually producing - not just that the positions existed, but whether the work justified the structure. Headcount audits in multiple counties surfaced ghost workers, duplicated roles and salary scales that had been inherited from predecessor structures rather than designed around what the county needed to deliver. Several counties used the resulting data to restructure - consolidating functions, rationalising management layers and redirecting wage bill savings into service delivery and infrastructure maintenance.
The mechanism was imperfect - political pressures in some counties meant restructuring stalled or was watered down. But the counties that moved made a consistent finding: the data itself changed what leadership was willing to accept. Once the evidence was on the table - the cost of a function per unit of output, the span of control, the duplication - the conversation moved from whether to optimise to how. South Africa’s challenge is structurally similar and institutionally more complex. But the Kenya experience reinforces what Butler argues: the diagnostic is not just a technical exercise. It is the political instrument that makes change possible.
THE FORWARD VIEW
Whether optimisation is initiated from within or imposed from outside is now a leadership choice - but it is not a permanent one.
The pressure on municipalities to optimise is building from multiple directions. National Treasury has signalled a harder line on municipal fiscal management. The AGSA-CoGTA 10x10 Forum is explicitly designed to move audit findings into coordinated intervention. Eskom is no longer absorbing municipal debt as a long-term reality - it is actively pressing for payment compliance and flagging the systemic threat the debt level poses. As South Africa moves towards the next local government electoral cycle, incoming councils will inherit these operating and financial realities.
The municipalities that will be best positioned in the next cycle are not necessarily the ones that have already solved every problem. They are the ones that have undertaken an honest diagnostic, know precisely where their structure is misaligned with their mandate, and have a credible, evidence-based plan to change it. That plan does not need to be complete. It needs to be real - built from the actual data, owned by leadership and monitored against measurable outcomes.
What two decades of performance work across South Africa’s most complex municipalities consistently shows is this: sustained improvement depends on leadership being willing to act on what credible evidence shows - including findings that are politically or personally uncomfortable - and on building accountability around implementation.
The diagnostic is where that process starts. Once the evidence is clearly on the table - the cost of a function per unit of output, the management layers, the duplication, the maintenance deferred - the conversation shifts from whether to optimise to how. The window for that choice is always open. The question is how long each municipality waits before taking it.
Featured Podcast
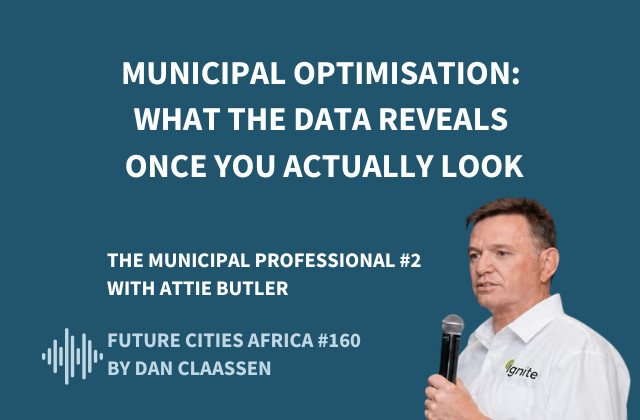
Municipal Optimisation - What the Data Reveals Once You Actually Look
Over 20 years experience - Ignite doesn't theorise about optimisation - they build it, inside the institutions that need it most. In episode two, we look at why municipalities can be over-resourced in some places and under-resourced in others - and what the data reveals once you actually look.
Listen NowUpcoming Webinars

Recommended Podcasts